Move 0.4 operator from station 3 to station 4
+0.4 operatorStation 4 cannot keep up with demand, station 3 has slack. The transfer brings the bottleneck back under takt without touching the routing.
Time study and line balancing
StreamVAL times your stations, computes standard time and takt, and tells you where to rebalance the line. Built for methods and production teams in industrial SMEs.
The problem
Times end up in a spreadsheet, the yamazumi goes stale as soon as demand changes, and staffing is settled on instinct. StreamVAL connects all three moments in one traceable calculation.
The reading
A stopwatch, a sheet of paper, and times that never leave the binder.
The spreadsheet
Every line has its own. The formulas differ from site to site, and nobody knows which one is authoritative any more.
The decision
Moving one operator from one station to another: nobody can say what it would gain.
How it works
The same data runs through all four steps. The number shown in the meeting stays tied to the shop-floor reading that produced it.
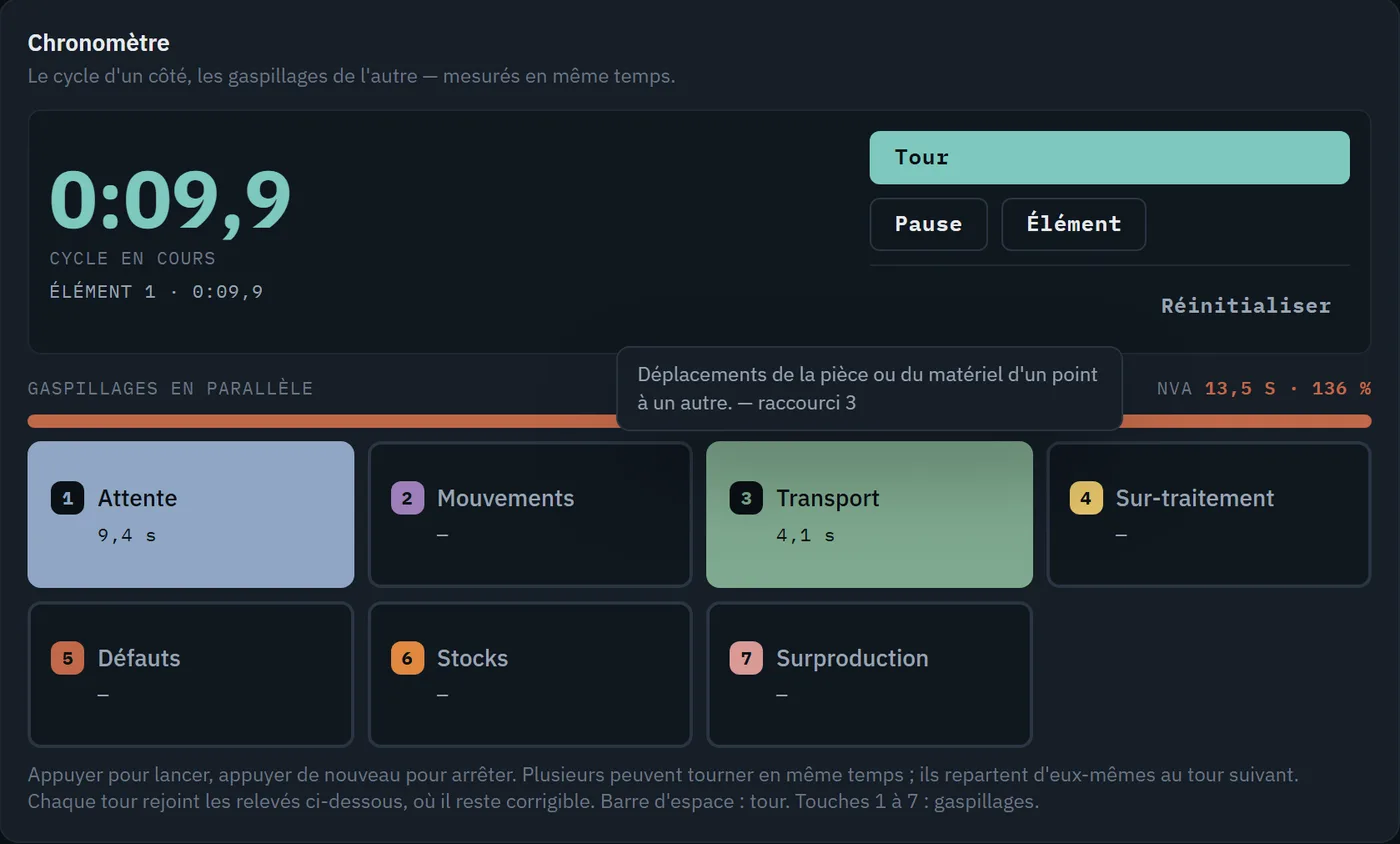
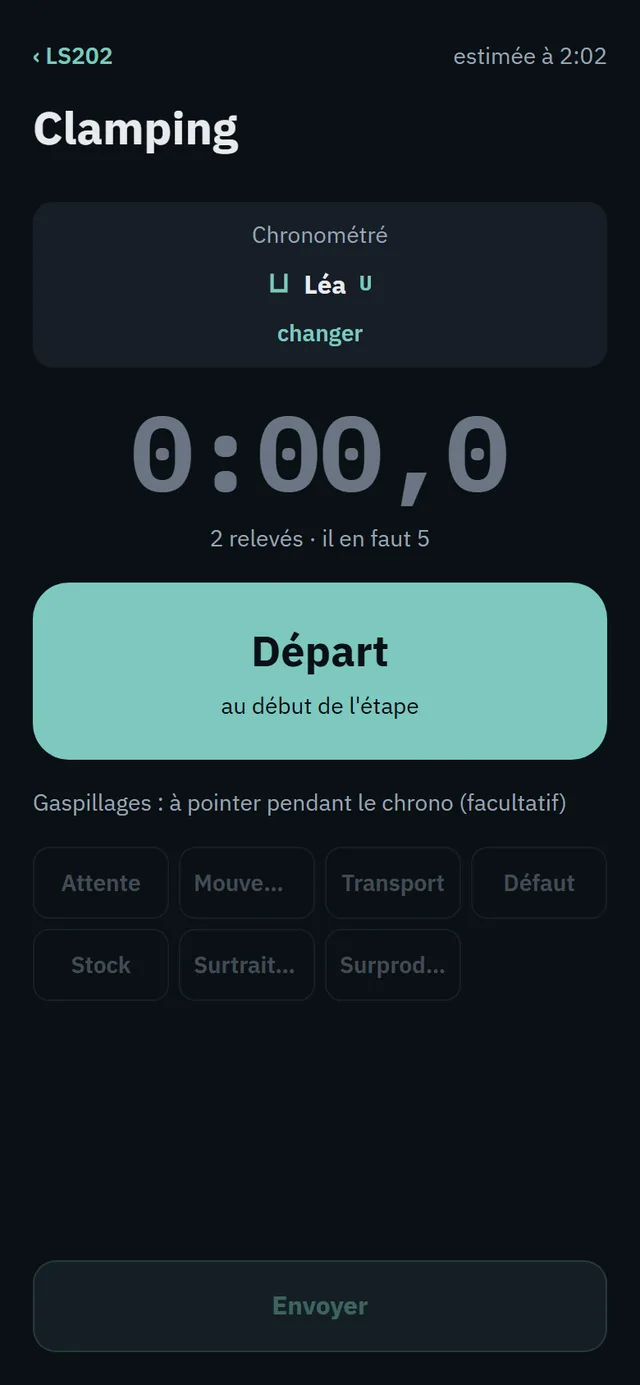
One station, laps, the seven wastes in parallel. The cycle runs while waiting and transport are tapped with one key — in full-screen mode there is nothing else to touch, gloves on.
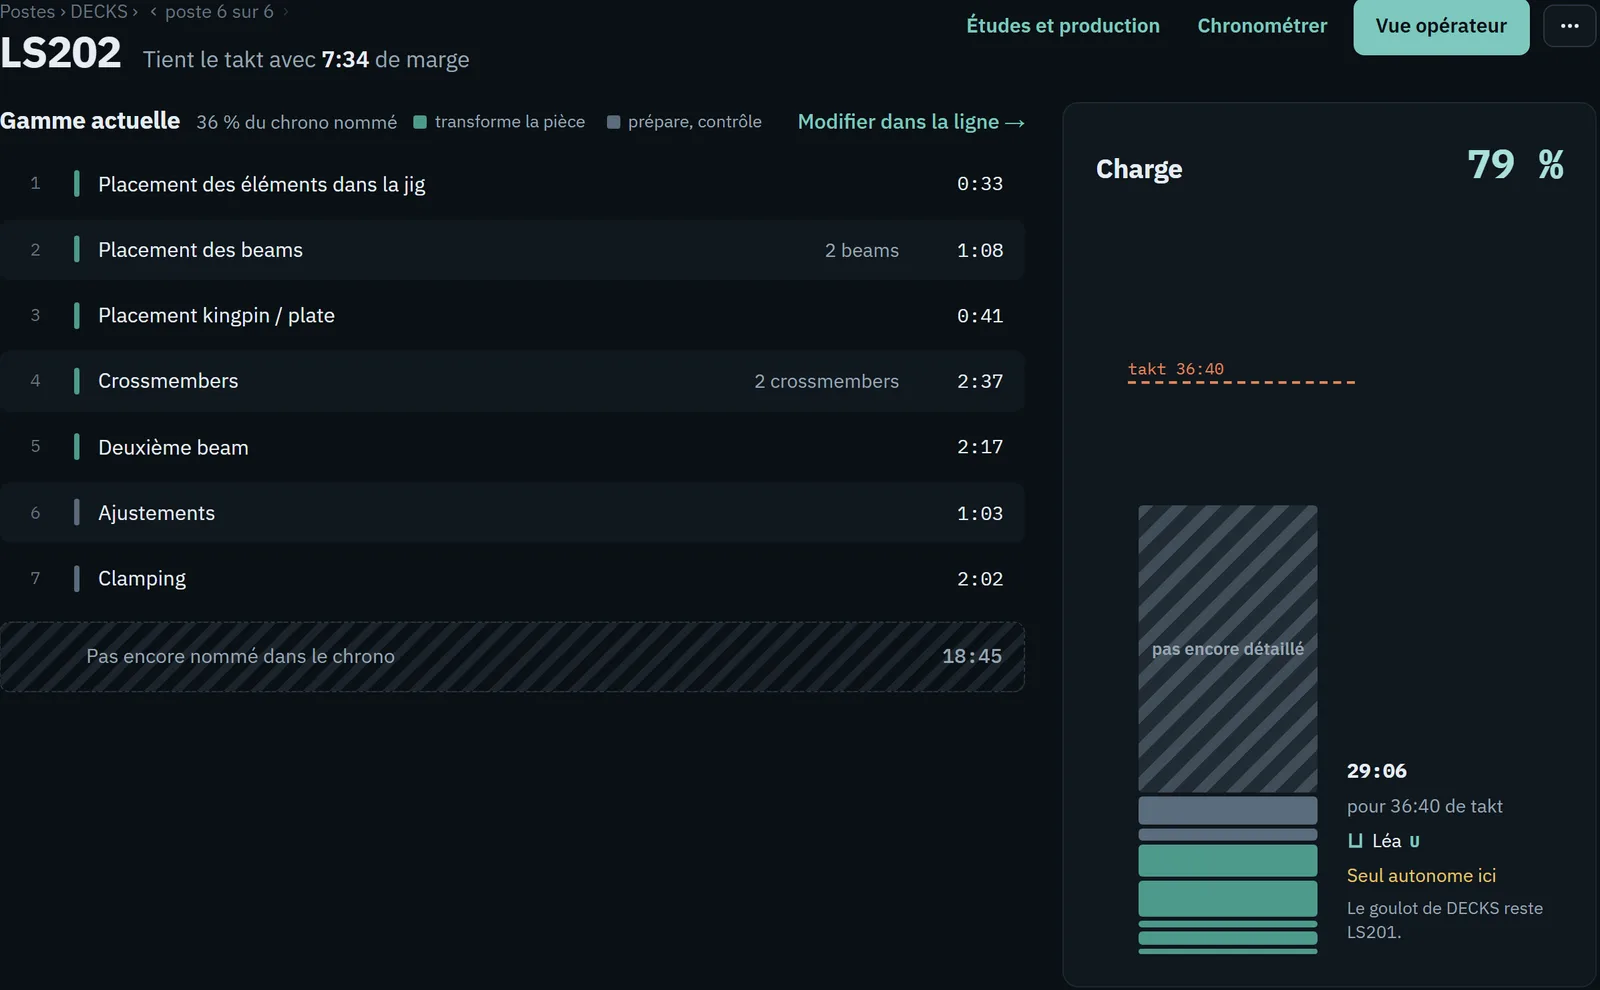
Performance rating and allowances applied to the reading, variation computed, sample size tracked. A discarded reading stays visible but no longer counts. One reference study per station: activating it deactivates the previous one.
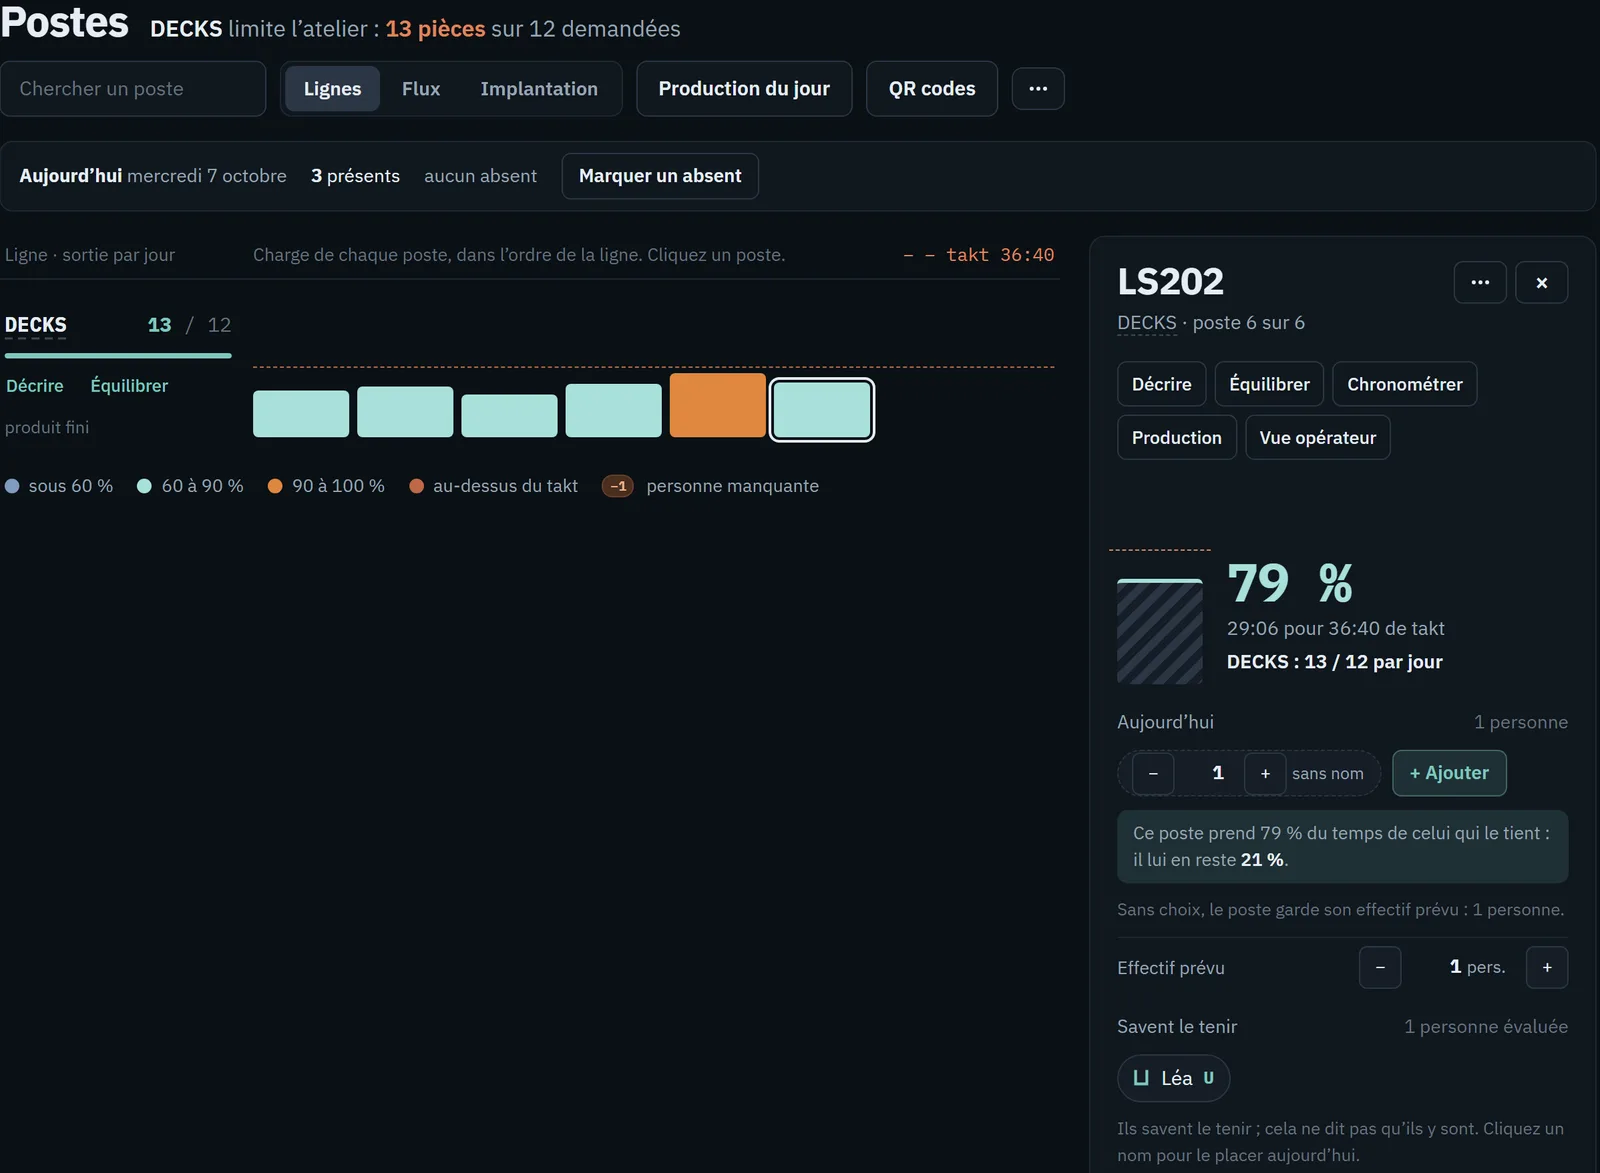
The line, its bottleneck, its balancing rate, its required headcount. The yamazumi redraws when demand changes, and a block of work slides from one station to its neighbour to see what it does.
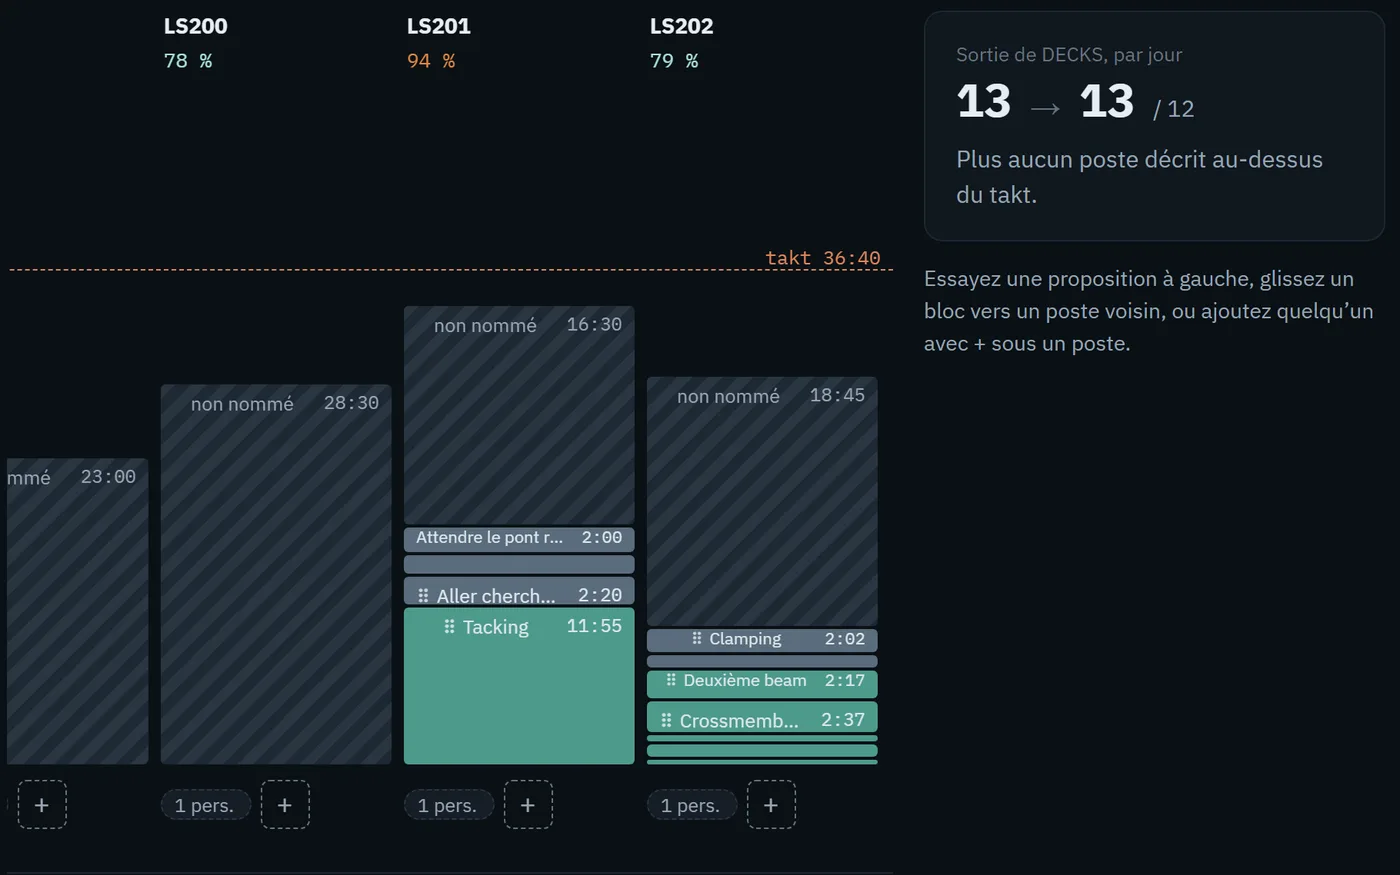
Every recommendation names the station, shows the evidence, quantifies the impact and proposes a countermeasure. Critical gaps come first; at equal severity, the gain decides.
Move 0.4 operator from station 3 to station 4
+0.4 operatorStation 4 cannot keep up with demand, station 3 has slack. The transfer brings the bottleneck back under takt without touching the routing.
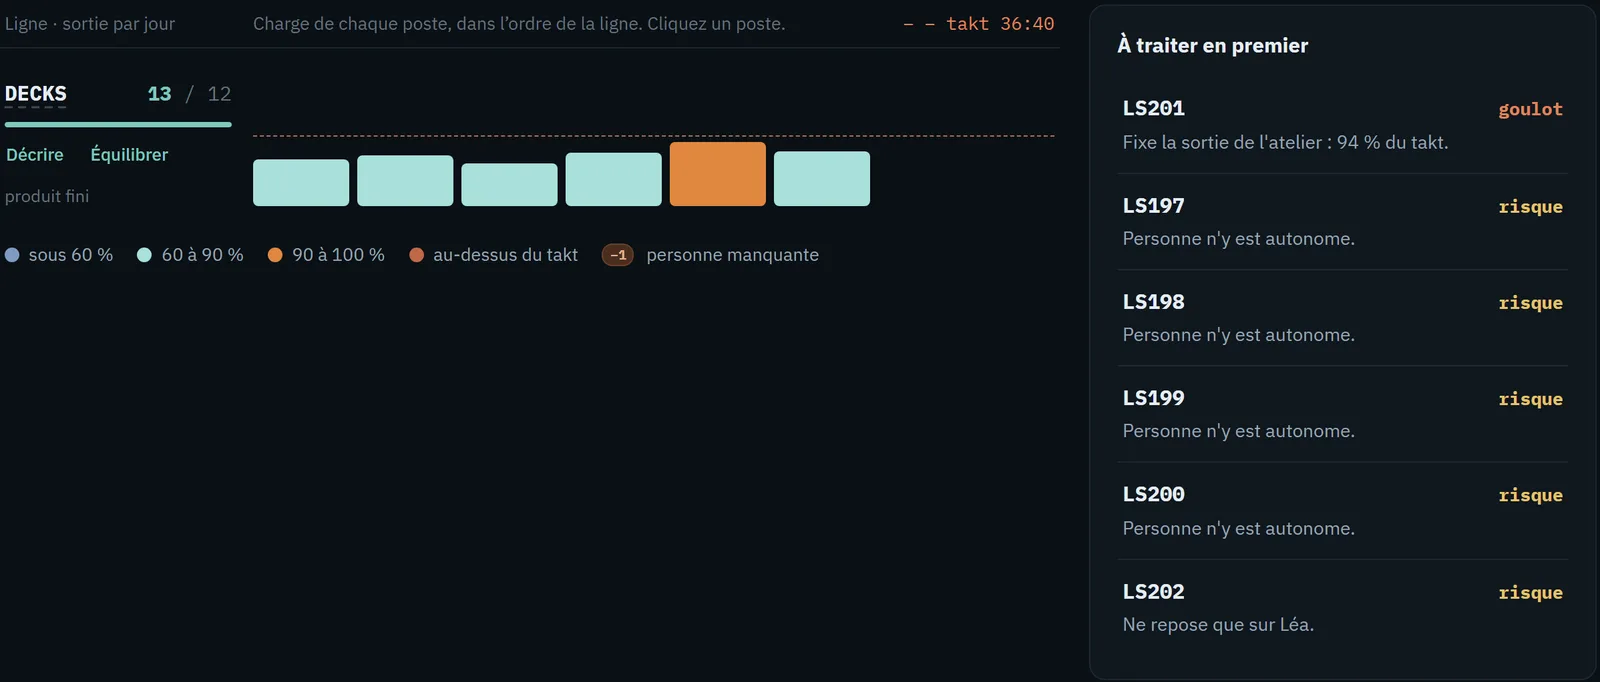
StreamVAL screenshots on a demonstration line. No real shop-floor data.
Simulator
Takt, bottleneck, capacity, line balance and required headcount update together. The simulator applies StreamVAL’s reasoning to a fictional five-station line.
Parts enter at takt and pile up in front of the station whose cycle exceeds takt.
Takt, playable
The starting values describe a fictional line. Replace them with your own orders of magnitude: nothing is sent anywhere, everything runs in the browser.
The effective cycle of each station, headcount included.
Station 4 cannot keep up with demand: its cycle exceeds takt by 4 min. The line caps out at 14 pcs over the period.
Balancing drops to 74 %. Between the busiest station and the others, 45 min of work content sits idle.
At the current takt, 4.17 operators are enough to hold demand — 0.83 operators over.
Who it is for
Production and methods manager
Replaces the stopwatch, the spreadsheet and the hand-drawn yamazumi. A line can be timed in a day.
Industrial management
The same calculation across every site, routings partitioned by product, and an installation on your own server if you want one.
Lean consultant
The tool travels from engagement to engagement. Each client stays sealed off, and the CSV export feeds the report.
Your data
Questions
Scope, data, deployment and methods: what StreamVAL does — and what it does not claim to do.
On-premise installation is available: studies stay on your infrastructure and times never leave the company. On the hosted instance, each company has its own organisation and accounts, isolated down to the database, and the CSV export hands you all of your times whenever you decide.
StreamVAL measures by time study: observed time, performance rating, allowances. That is a choice — field measurement rather than the theoretical standard.
StreamVAL does not try to match them feature for feature. It does not provide video work instructions or predetermined motion times. It connects a stopwatch study to takt, actual capacity and staffing decisions.
A first diagnosis fits into one shop-floor day: create the product, define the stations and time the line. The robustness of the standard then depends on sample size and variation.
The current version needs network access to its API. A dedicated deployment can remain inside the site network; a fully offline mode is not available today.
Pricing depends on deployment scope, number of sites and onboarding support. A clear proposal follows scoping, with no hidden cost added during the pilot.
What next
Bring one line, its demand and a station to time. StreamVAL turns the measurement into an action plan that production and methods can challenge together.